What 320 horror works look like when you measure them
Every claim below is arithmetic on the same 320 vectors published at /data under CC BY 4.0, and every one can be recomputed from the CSV. This is the only document here that is about the index rather than about a work.
Read this before the numbers
These are findings about this index, not about horror. The 320 works were chosen by us, so a pattern in them describes our selection at least as much as the form, and a different two hundred works could move any of these numbers. 0 of 320 vectors have been confirmed by a second reviewer. Era Bias is excluded throughout: it measures texture rather than fear, so a correlation with it would describe how works look, not how they frighten.
A relationship is printed only if it clears a significance bar in the whole index and inside the films and across everything that is not a film, in the same direction each time. Each bar is the |r| that chance beats about once in a thousand runs at that group's own sample size, measured from 20,000 shuffles rather than taken from a table, because these scores are not normally distributed. The bars: the whole index 0.19 at n = 320, the films 0.21 at n = 236, everything that is not a film 0.35 at n = 84. A smaller group needs a much stronger relationship before it is surprising, which is why one bar for all three would have waved things through. The three tests are not independent — treat a surviving line as one claim that withstood three looks, not as three proofs. 10 pairings were examined, which is itself a reason to want a high bar. Seeded (20261019), so these figures are reproducible.
What moves with what
- Pace of Fear and Tone move together — the higher one runs, the higher the other. the whole index r = +0.52; the films r = +0.46; everything that is not a film r = +0.42.
- Pace of Fear and Viscera move together — the higher one runs, the higher the other. the whole index r = +0.49; the films r = +0.39; everything that is not a film r = +0.50.
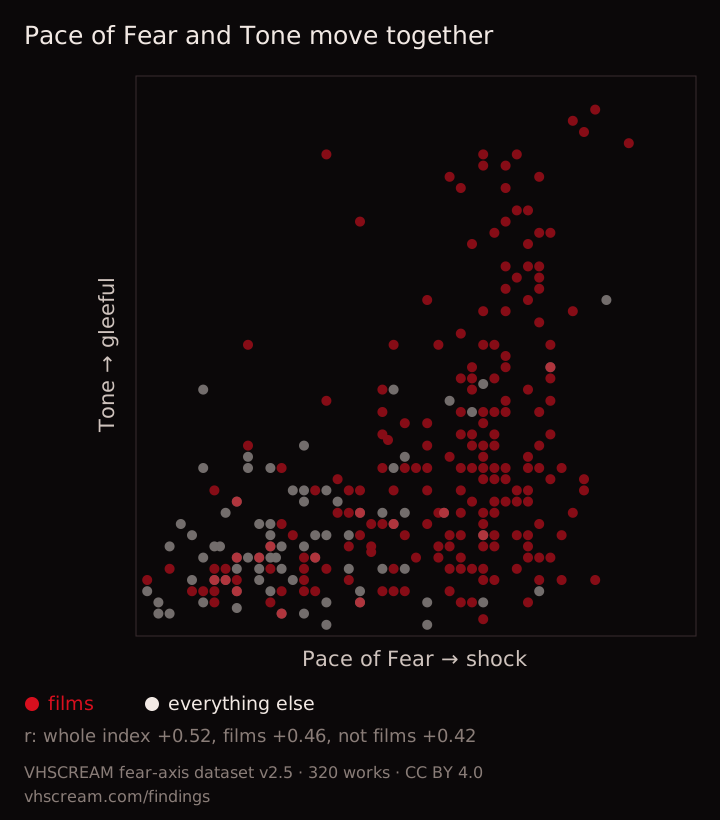
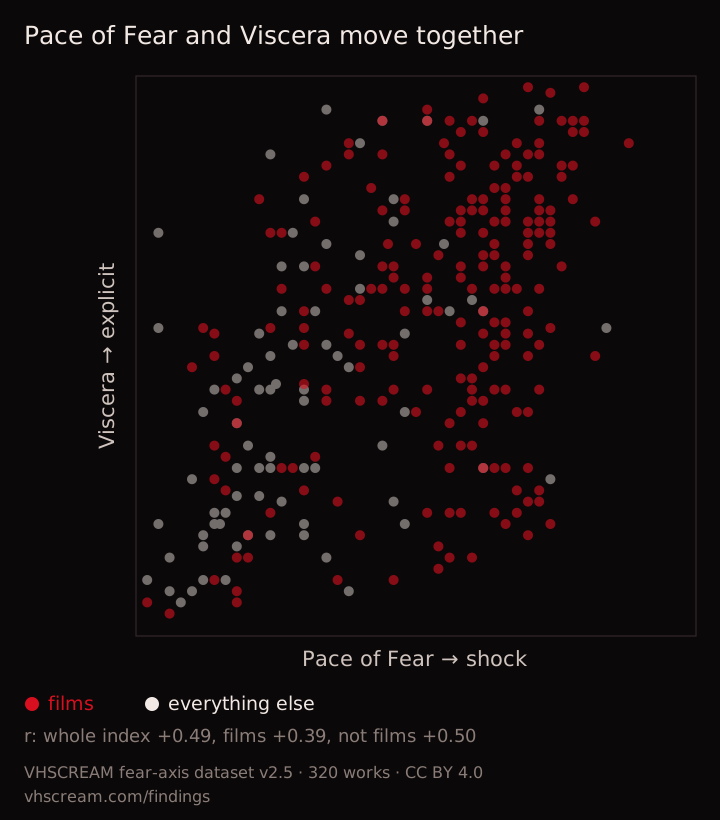
2 of 10 pairings survived. The rest are not evidence of no relationship; they are pairings this index cannot distinguish from chance.
Where the media differ
- Pace of Fear: film average 54, television average 28 — 26 points apart.
- Viscera: film average 58, record average 34 — 24 points apart.
- Tone: film average 32, book average 17 — 15 points apart.
- Reality Anchor: record average 67, film average 47 — 20 points apart.
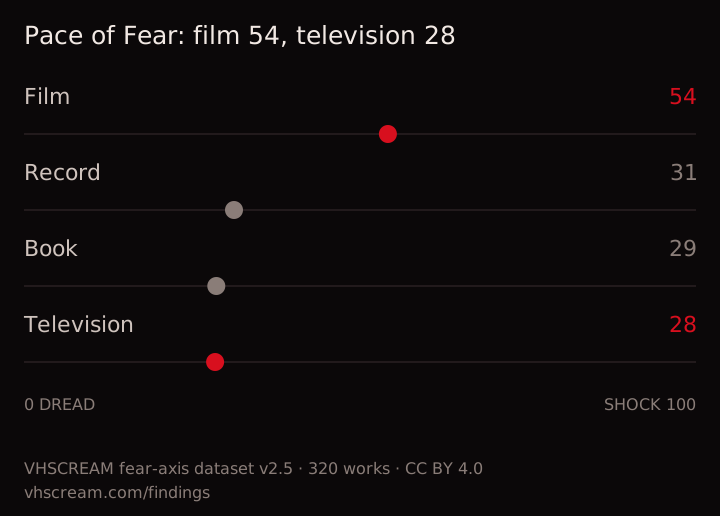
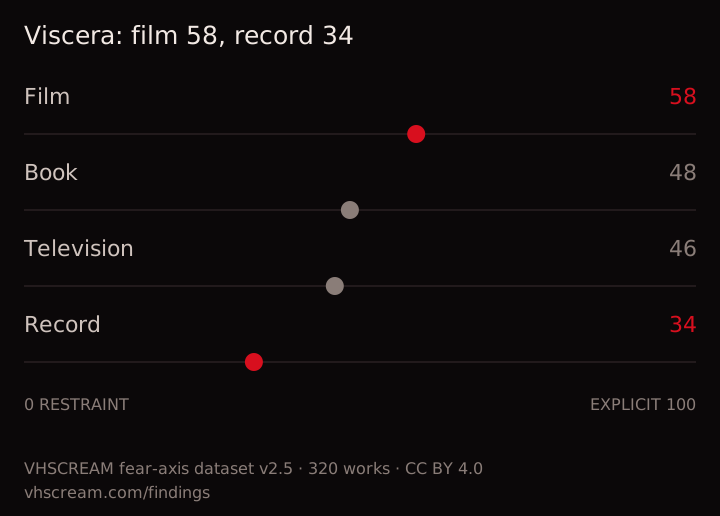
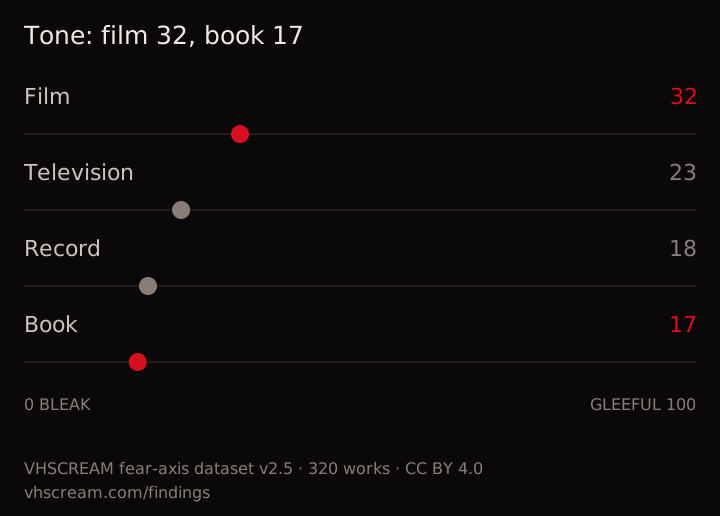
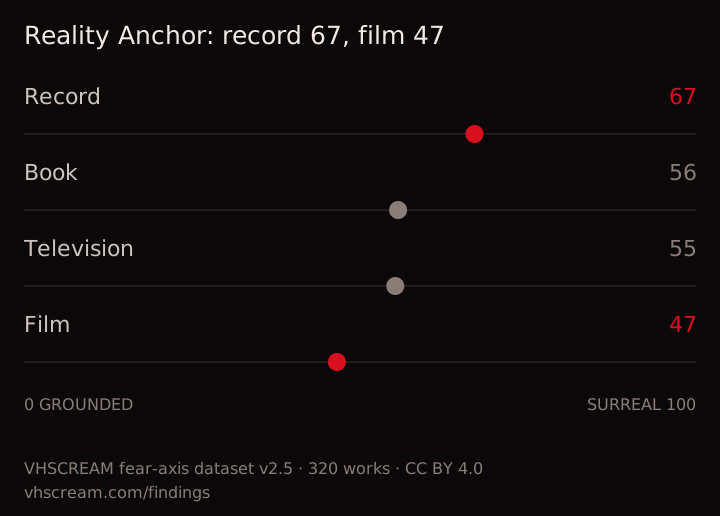
Only gaps of 12 points or more between media holding at least 12 works each, so a gap printed here is not two or three titles pulling an average around. If a gap closes, its line disappears on the next build rather than going stale.
Method, in full
Pearson's r on the raw 0–100 scores; group means unweighted; nothing smoothed or adjusted. Every section is regenerated from the live index on each build and prints only while its own finding still holds, so a number here cannot outlive the data it came from. The charts are drawn from the same lists as the sentences, so a chart disappears with its finding. Every chart is free to reuse under CC BY 4.0 with a credit to VHSCREAM and a link to this page; the downloadable files carry that credit inside them.
The data behind it → · The adaptation spine → · What a match percentage is worth → · What each score looks like → · How the scoring works →
Questions about the findings
What are these horror findings computed from?
The published dataset and nothing else: 320 horror works scored on six axes against a published rubric, under CC BY 4.0. Every figure on this page is recomputed on each build from those rows, so a finding cannot outlive the data it was drawn from, and the charts are generated from the same lists that print the sentences.
Which fear axes actually move together?
Of 10 pairs of the axes that measure fear, two clear their significance bar in the whole index, inside the films and across everything that is not a film, all three in the same direction. Those are listed on this page with their coefficient in each group. The rest are not reported rather than reported weakly.
How many works is each finding based on?
The whole index is 320 works, which puts the bar a correlation has to clear at 0.19; the two sub-groups are smaller, so their bars are higher and stated beside them. A pair that clears one group and not another is not a finding here, which is why the list is short.
Can I reuse the charts on this page?
Yes. Each one downloads as a standalone SVG with its own source line drawn inside the image, so the credit travels with the file rather than depending on the page it came from. The underlying dataset is CC BY 4.0, so a chart redrawn from it needs attribution and nothing else.
What can these numbers not tell you?
Whether anything is good. The axes are descriptive, so a correlation here says two measured qualities move together in this catalogue, not that one causes the other and not that either is a merit. The index is also what one eye has chosen to score, so it describes this collection of horror rather than horror itself.